


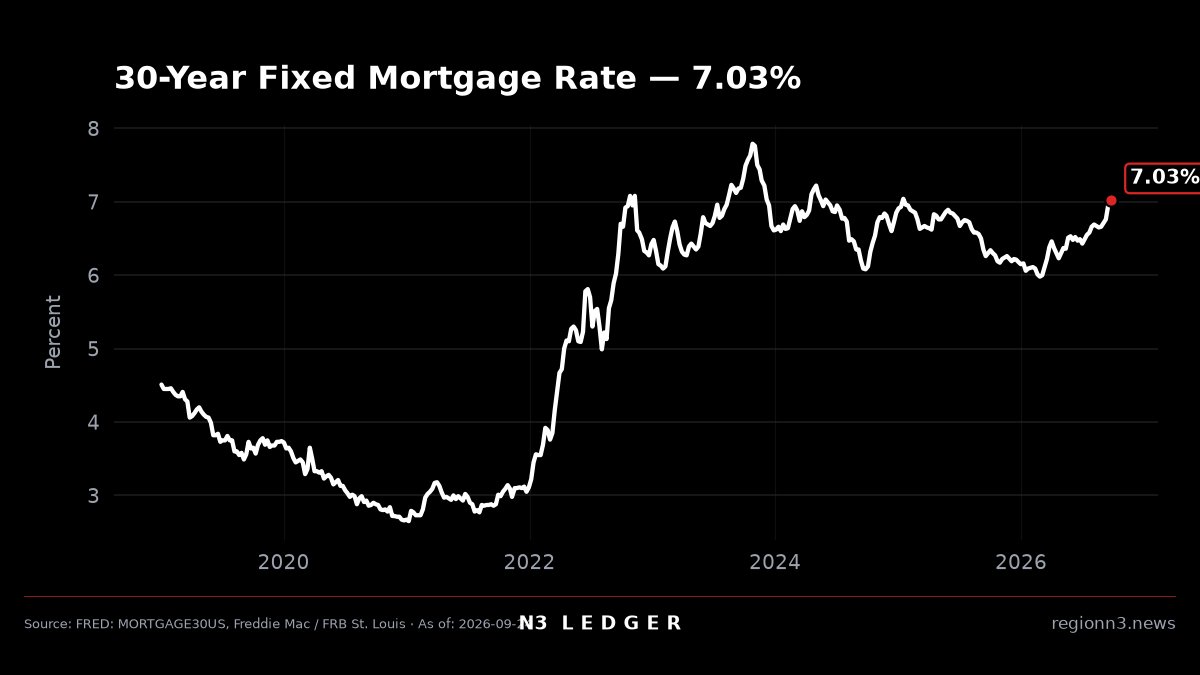
UNITED STATES — N3 Ledger chart of the 30-year fixed mortgage rate, built from FRED series MORTGAGE30US (Freddie Mac Primary Mortgage Market Survey), shows 7.03% for the week of 2026-09-24. Inside the chart window, the series trough was 2.65% on 2021-01-07.
That is a national average rate, not a quote from a Crown Point or Portage lender. It is still the yardstick banks and brokers watch every Thursday when Freddie Mac releases the survey.
| Item | Figure |
|---|---|
| Series | MORTGAGE30US (Freddie Mac PMMS) |
| Latest average | 7.03% |
| Week of | 2026-09-24 |
| Window trough | 2.65% on 2021-01-07 |
| Spread trough → latest | +4.38 percentage points |
| Source | FRED / Freddie Mac |
In plain English
This chart is simpler than the CPI and wage companions. It is a rate line, not an index.
- The line is the weekly national average for a 30-year fixed mortgage. When the line is high, new borrowers pay more interest each month for the same loan size.
- The red callout 7.03% is the latest weekly average (week of Sept. 24, 2026). It is not your personal quote; quotes still vary by credit score, down payment, and lender.
- What changed since 2020–21: In early 2021 the same series touched 2.65%. At 7.03%, the rate is more than 4 percentage points higher than that trough. A bigger share of each monthly payment goes to interest instead of principal when rates are elevated.
- Household example (no invented payment amounts): We are not inventing a fake $X monthly payment for a made-up house price. Use the rate gap itself: moving from 2.65% to 7.03% is a +4.38 percentage-point jump on the national average. That gap is why buyers who could stretch at ~3% often cannot clear underwriting at ~7% on the same sticker price — without a larger down payment, a cheaper house, or both.
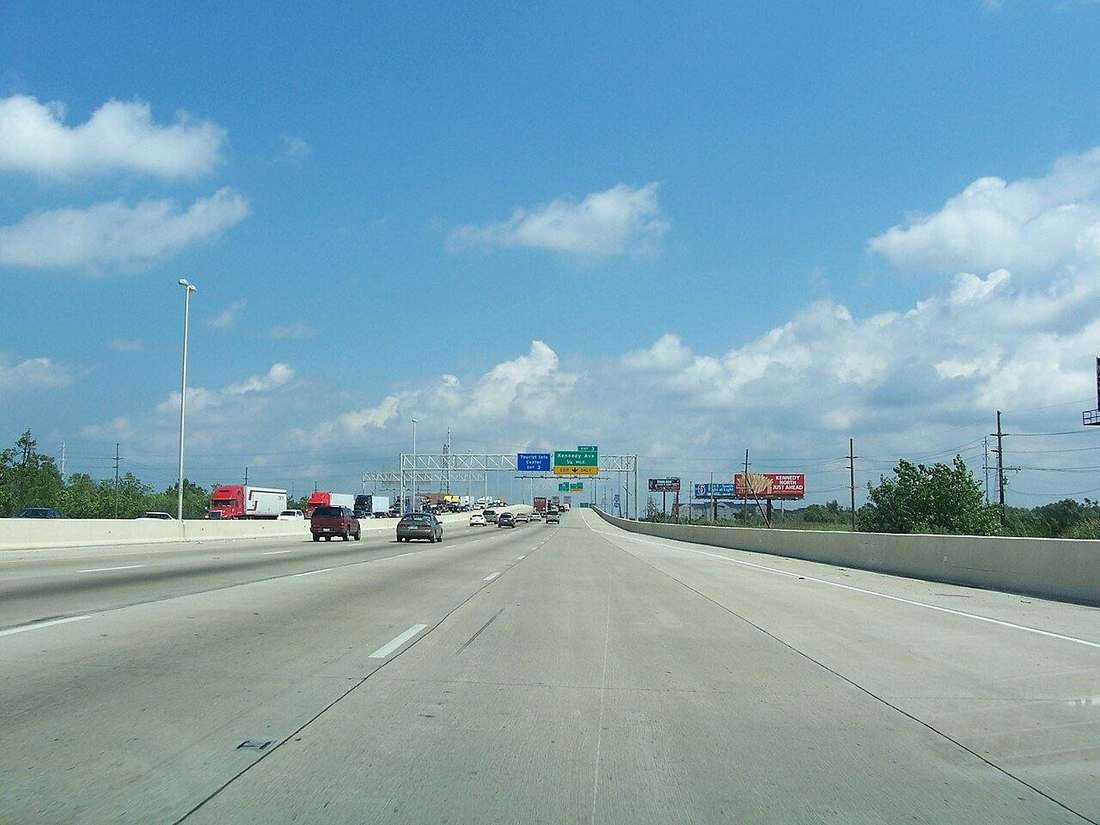
For Northwest Indiana, elevated mortgage rates hit two groups at once. Workers taking new mill, warehouse, or logistics jobs need a place to live within commuting distance of the I-65 and lakeshore corridors. Employers recruiting from outside the region compete with housing payments that jumped with the national rate, not just with local list prices. Soft frame only: Lake, Porter, and LaPorte sit inside the same Freddie Mac average as the rest of the country.
How N3 Ledger built the chart
N3 Ledger plots FRED’s weekly MORTGAGE30US series. Latest point: 7.03%, week of 2026-09-24. Window trough labeled on the chart: 2.65% on 2021-01-07. Source: fred.stlouisfed.org/series/MORTGAGE30US (Freddie Mac via Federal Reserve Bank of St. Louis).
Companion Ledger charts cover purchasing power (what a dollar buys) and real average hourly earnings (what an hour of work buys after inflation). Together they sketch costs, pay, and housing capital in one package.
Related reading
- Your 2020 dollar buys about 78 cents — N3 Ledger reading the CPI
- Real hourly pay barely beats 2020 — N3 Ledger on wages after inflation
- Amazon leases Crown Point fulfillment hub, pledges 500 jobs
- I-65 warehouse corridor
Photo credit
¹ N3 Ledger / Region N3 — MORTGAGE30US chart; data from FRED / Freddie Mac. ² Region N3 stock / traffic — Borman Expressway corridor art; not a specific listing or closing. N3 Ledger / Region N3 (chart; FRED / Freddie Mac data) — N3 Ledger chart — U.S. 30-year fixed mortgage rate (MORTGAGE30US). Latest 7.03% week of Sept. 24, 2026; window trough 2.65% on Jan. 7, 2021.