


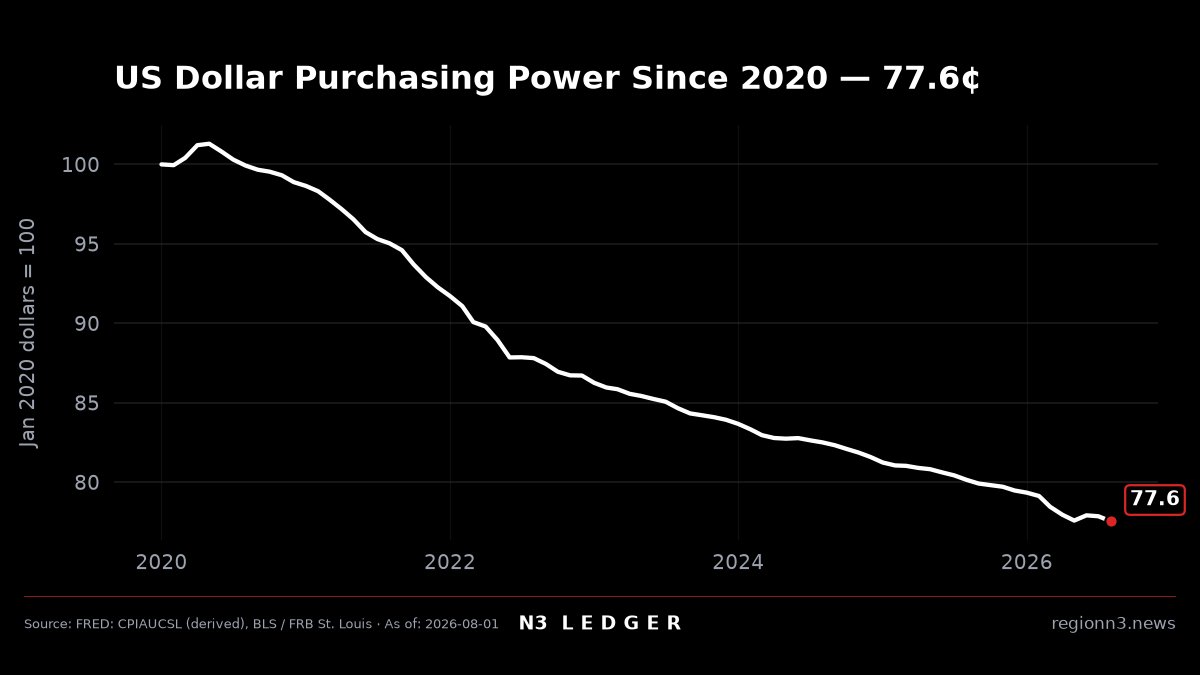
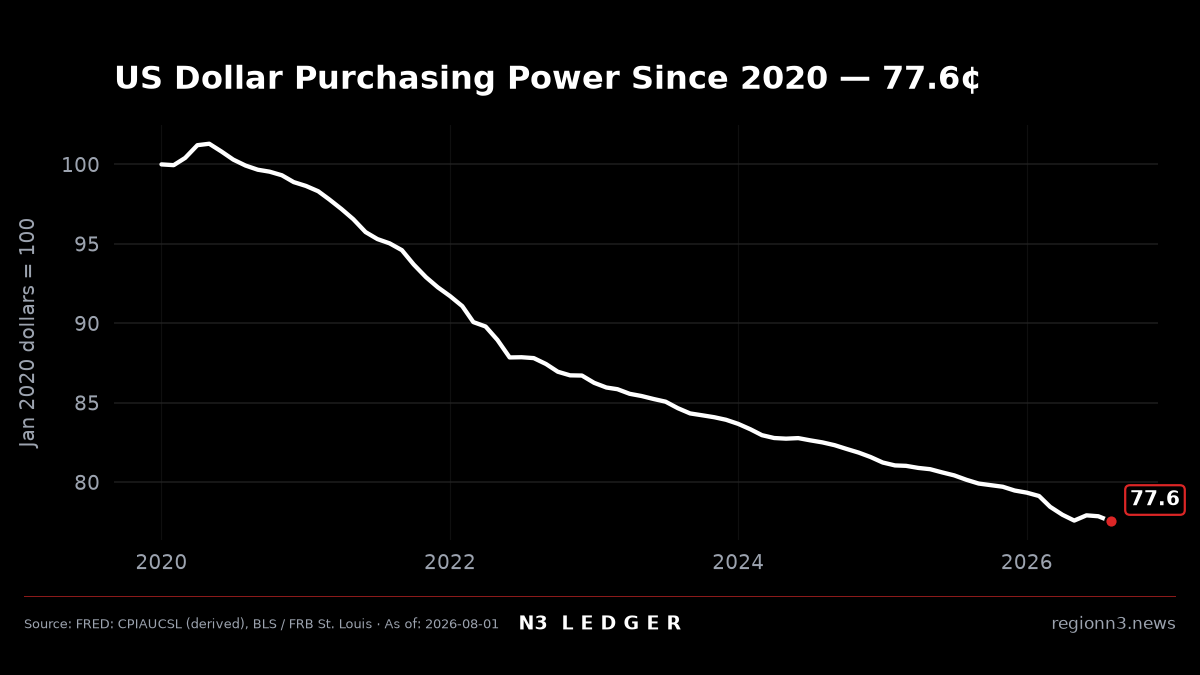
UNITED STATES — N3 Ledger chart of U.S. purchasing power, built from the Federal Reserve Bank of St. Louis FRED series CPIAUCSL, shows the dollar at about 77.6 on an index where January 2020 equals 100. As of the August 2026 CPI print (observation dated 2026-08-01), that is roughly a 22.4% loss of buying power since the start of the decade.
The series is the Consumer Price Index for All Urban Consumers: All Items, seasonally adjusted, published by the U.S. Bureau of Labor Statistics and mirrored on FRED. January 2020 CPI stood at 259.127. August 2026 CPI stood at 334.131. The purchasing-power index is simply 100 × 259.127 / 334.131 = 77.55, rounded to the chart callout 77.6.
| Item | Figure |
|---|---|
| Base month | January 2020 |
| Base CPI (CPIAUCSL) | 259.127 |
| Latest CPI | 334.131 (as-of 2026-08-01) |
| Purchasing-power index | 77.55 (chart callout 77.6) |
| Implied loss since Jan 2020 | ~22.4% |
| Source | FRED CPIAUCSL (BLS) |
In plain English
Think of the chart as a score for how far one dollar stretches compared with January 2020.
- The line tracks that score over time. January 2020 starts at 100. Every later point answers: “If I had $100 of buying power then, how many dollars of buying power do I have now?”
- The red callout 77.6 is the latest answer. About $77.60 of 2020 buying power is left in a dollar today — not a stock tip, just CPI math.
- What changed since 2020: Prices for the all-items urban basket rose from a CPI of 259.127 to 334.131. Divide the old CPI by the new one, multiply by 100, and you get 77.55. That is why the callout sits near 78, not near 100.
- Household example (no invented receipts): If a cart of groceries cost $100 in January 2020 dollars of buying power, you need about $100 ÷ 0.7755 ≈ $129 in today’s dollars to buy the same cart — because the dollar’s purchasing-power index is 77.55. We are not inventing a store receipt; we are applying the index itself.
For Lake, Porter, and LaPorte County households, that math shows up at the same places everyone already feels: the grocery aisle, the fill-up, and the rent or mortgage bill. It does not say every local price moved exactly with the national CPI. It says the national yardstick for “what a dollar buys” is down about 22% since early 2020. Employers competing for warehouse, mill, and service workers face the same cost pressure on the other side of the paycheck.

How N3 Ledger built the chart
N3 Ledger does not invent a separate inflation series. It takes FRED’s CPIAUCSL and indexes purchasing power to January 2020 = 100 with the formula 100 × CPI_Jan2020 / CPI_t. When CPI rises, the purchasing-power line falls. The August 2026 observation is dated 2026-08-01 on FRED. Full series: fred.stlouisfed.org/series/CPIAUCSL.
Companion Ledger charts cover real average hourly earnings and the 30-year mortgage rate — the wage and housing sides of the same cost-of-living story.
Related reading
- Real hourly pay barely beats 2020 — N3 Ledger on wages after inflation
- 30-year mortgage at 7.03% — N3 Ledger on housing capital costs
- Amazon leases Crown Point fulfillment hub, pledges 500 jobs
Photo credit
¹ N3 Ledger / Region N3 — purchasing-power chart; data from FRED CPIAUCSL (BLS). ² Region N3 stock / utility — illustrative cost-of-operations art; not a local rate case photo. N3 Ledger / Region N3 (chart; FRED/BLS data) — N3 Ledger chart — U.S. dollar purchasing power indexed to January 2020 = 100. Callout 77.6 as of August 2026 (FRED CPIAUCSL).