


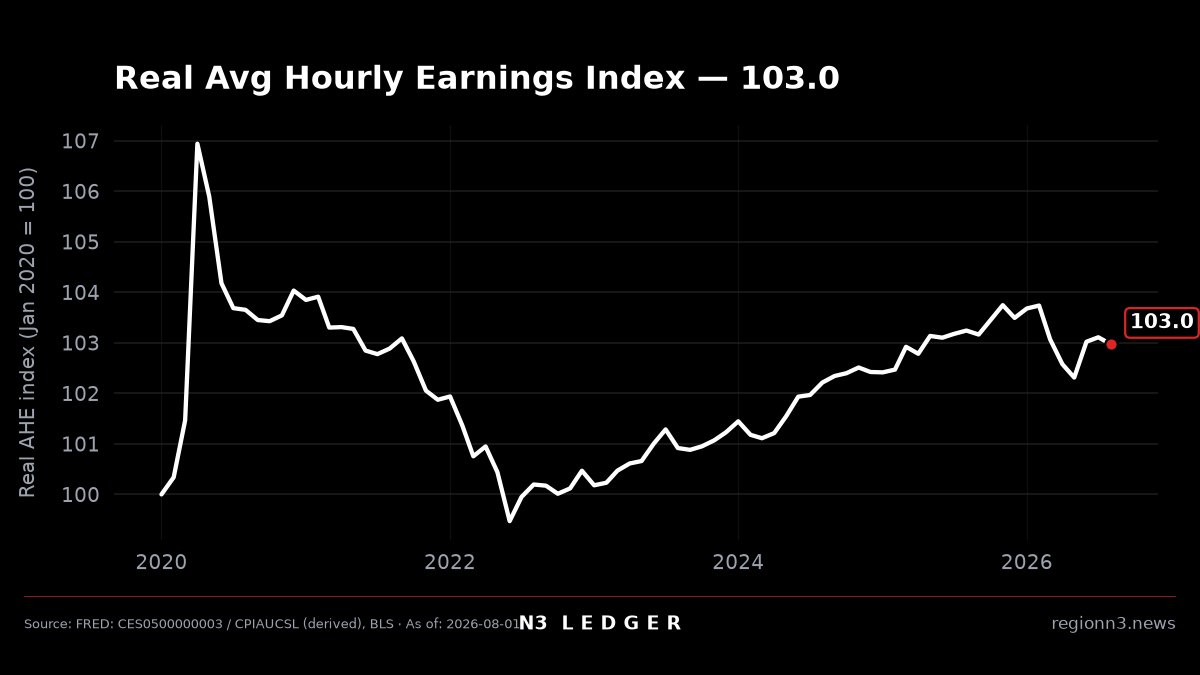
UNITED STATES — N3 Ledger chart of real average hourly earnings puts private-sector pay at 102.98 on an index where January 2020 equals 100. The latest observation is dated 2026-08-01. Nominal average hourly earnings for all private employees stand at $37.75. Deflated by CPI, that is about $29.28 in January 2020 dollars.
The chart is derived, not pulled from a single published real-wage series. FRED’s CES0500000008 (the BLS published real AHE line) returned an HTTP 404 on CSV download at build time. N3 Ledger therefore used CES0500000003 (nominal AHE, total private, seasonally adjusted) divided by CPIAUCSL, then re-indexed so January 2020 = 100. That method is transparent and reproducible from the two live series.
| Item | Figure |
|---|---|
| Index base | January 2020 = 100 |
| Real AHE index (latest) | 102.98 |
| Nominal AHE | $37.75 / hr |
| In Jan-2020 dollars | ≈ $29.28 / hr |
| YoY index change | −0.27 points |
| As-of | 2026-08-01 |
| Method | CES0500000003 ÷ CPIAUCSL (derived; CES0500000008 CSV 404 at build) |
In plain English
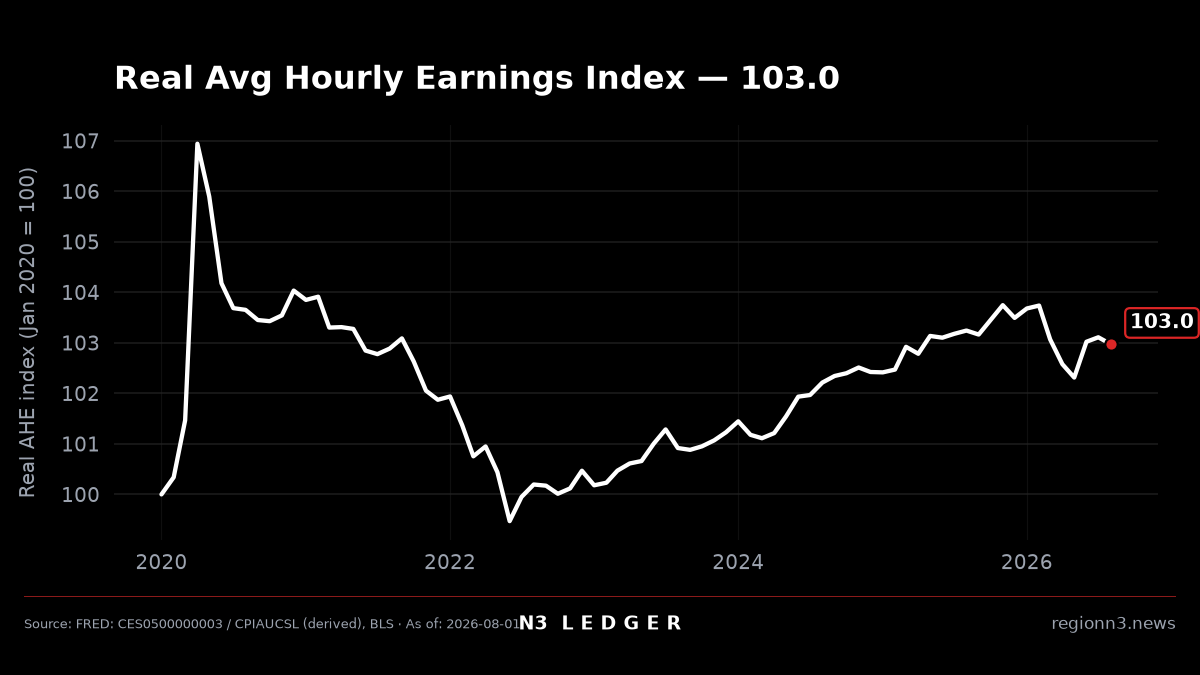
This chart answers one question: after prices, did the typical private-sector hour of work buy more or less than in January 2020?
- The line is an index. 100 means the same real buying power as January 2020. Above 100 means a little more; below 100 means less.
- The red callout ~103 (102.98) means real hourly pay is only about 3% above early-2020 levels — not a windfall, and not a collapse either.
- What changed since 2020: Nominal wages rose to $37.75/hr. Prices rose too. Strip inflation out with CPI and you get about $29.28 in January 2020 dollars. The index at 102.98 is that comparison in one number. Year over year, the index fell 0.27 points — real pay edged down recently even if the long climb from 2020 is still slightly positive.
- Household example (no invented pay stubs): Take the published nominal figure itself. $37.75 today has the buying power of about $29.28 in January 2020 dollars. That is the same hour of work, measured two ways. We are not inventing a local wage schedule; we are reading the national average through the CPI deflator.
For Northwest Indiana workers — mills, warehouses, ports, hospitals, retail — the national average is a yardstick, not a paycheck stub from Gary or Valparaiso. It still matters. When the real-wage index sits near 103 while grocery and housing costs stay elevated, employers posting new fulfillment and plant roles compete for people who feel prices more than they feel a three-percent real gain. Soft frame only: Lake, Porter, and LaPorte payrolls live inside the same national CPI and AHE math.

How N3 Ledger built the chart
Formula in plain terms: take nominal AHE from CES0500000003, divide by CPIAUCSL, then scale so the January 2020 ratio equals 100. Latest print: index 102.98, nominal $37.75/hr, real ≈ $29.28 in Jan-2020 dollars, YoY index −0.27 points, as-of 2026-08-01.
Sources: CES0500000003 and CPIAUCSL. If BLS/FRED restore a clean CES0500000008 CSV later, Proof can note a series swap; until then, say “derived” in the caption and body.
Companion Ledger charts cover purchasing power (the CPI side alone) and the 30-year mortgage rate (the housing-capital side).
Related reading
- Your 2020 dollar buys about 78 cents — N3 Ledger reading the CPI
- 30-year mortgage at 7.03% — N3 Ledger on housing capital costs
- Amazon leases Crown Point fulfillment hub, pledges 500 jobs
- Cliffs NWI hiring
Photo credit
¹ N3 Ledger / Region N3 — real AHE chart; derived from FRED CES0500000003 and CPIAUCSL (BLS). ² Region N3 stock / tech — illustrative campus art; not a wage survey photo. N3 Ledger / Region N3 (chart; FRED/BLS data) — N3 Ledger chart — real private average hourly earnings indexed to January 2020 = 100. Index 102.98 as of August 2026 (derived from CES0500000003 ÷ CPIAUCSL).